top of page


Figure-1.The process of image formation in poor weather.
Atmospheric Scattering Model
Abstract
The visibility of an image captured in poor weather (such as haze, fog, mist, smog) degrades due to scattering of light by atmospheric particles. Single image dehazing (SID) methods are used to restore visibility from a single hazy image. Typically, the atmospheric scattering model (ATSM) is used to solve SID problem. The transmission and atmospheric light are two prime parameters of ATSM. The accuracy and effectiveness of SID depends on accurate value of transmission and atmospheric light. This method translates transmission estimation problem into estimation of the difference between minimum color channel of hazy and haze-free image. The translated problem presents a lower bound on transmission and is used to minimize reconstruction error in dehazing. The lower bound depends upon the bounding function (BF) and a quality control parameter. A non-linear model is then proposed to estimate BF for accurate estimation of transmission. The proposed quality control parameter can be utilized to tune the effect of dehazing.
Highlights
i. This method translates transmission estimation into the estimation of the difference between minimum color channel of hazy and haze-free image. The translated problem presents the lower bound on transmission.
ii The lower bound on transmission depends upon bounding function (BF). Therefore, a non-linear model to estimate BF is proposed.
Results
Results
Subjective Evaluation

Figure-2.Comparison of dehazing results on challenging hazy image with complex structure
Objective Evaluation

Figure-3.Comparison of transmissions. Hazy images are shown in first row. Second row presents comparison of optimized transmissions. Black curve represents GT of transmission. Magenta, cyan, red, and green curves represent the transmissions obtained by DP, CP, FT and the proposed method, respectively.

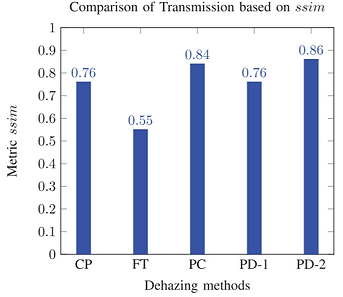
Figure-4. Comparison of transmission based on ssim using hazy images of NYU dataset. The CP, FT, and PC represent the methods in [18], [22], and [35] respectively. The label PD-1 and PD-2 represent the results of the proposed method with ζ = 12 and ζ = 23 respectively.
Analysis of the Time Complexity

Figure-5. Analysis of dehazing methods based on time complexity. The magenta, green, cyan, red, yellow, and blue curves represent the complexity of DP, CP, DN, PC, CG and the proposed method respectively.

Figure-6. Analysis of dehazing methods based on full computation time. The magenta, green, cyan, red, yellow, and blue curves represent the full computation time of DP, CP, DN, PC, CG and the proposed method respectively.
Downloads
Downloads
Citation
@article{raikwar-tapaswi,
author={Raikwar, Suresh Chandra and Tapaswi, Shashikala},
journal={IEEE Transactions on Image Processing},
title={Lower Bound on Transmission Using Non-Linear Bounding Function in Single Image Dehazing},
year={2020},
volume={29},
number={},
pages={4832-4847},
doi={10.1109/TIP.2020.2975909}
}
Citation
BibTex
S. C. Raikwar and S. Tapaswi, "Lower Bound on Transmission Using Non-Linear Bounding Function in Single Image Dehazing", in IEEE Transactions on Image Processing, vol. 29, pp. 4832-4847, 2020, doi: 10.1109/TIP.2020.2975909.
PlainText
bottom of page

